Bellwork
Facebook for math nerds
cIRCLE GRAPHS
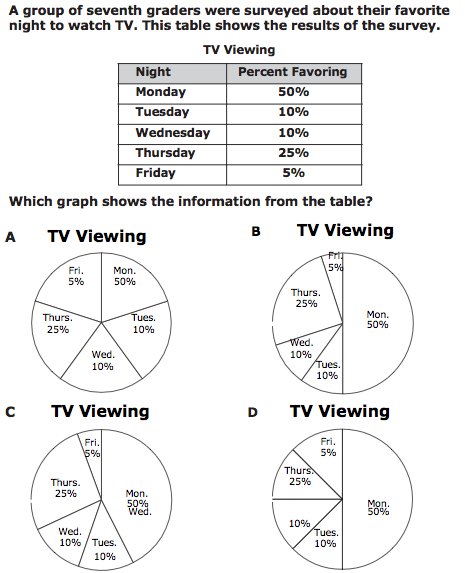
A circle graph is a graph that compares parts to a whole with related data. The circle is broken into parts that represent the whole data. Each part can be represented as a decimal, percentage or fractional part of the circle. They provide a visual example of how data may be split into sections.
venn diagram
A venn diagram is a diagram that is used to show relationships between sets of data. It illustrates the data within each set or circle, and the data that is in both sets of data. This is represented by the space where the two data sets or circles overlap. Another possibility is data outside of either set or circle that might be added to make the total for the entire data set. The diagram can be made of multiple sets or circles of data. The most common is two or three sets of data.
