Agenda

Data Analysis: Compare, translate, and interpret between displays of data
Today will be about reading tables and bar graphs
Today will be about reading tables and bar graphs
Bell work
How will you use graphs in your future job? Have you used them currently? Where and for what?
1 Paragraph please!
1 Paragraph please!
wHAT THE STATE NEEDS US TO DO
OAS Standard:
Standard 5: Data Analysis—The student will use data analysis, probability, and statistics to interpret data in a variety of contexts.
OAS Objective:
1. Data Analysis: Compare, translate, and interpret between displays of data (e.g., multiple sets of data on the same graph, data from subsets of the same population, combinations of diagrams, tables, charts, and graphs).
Item Specifications:
Emphasis: Demonstrate knowledge of data representation through translation and comparison.
Stimulus Attributes: Test items may include illustrations of the following: diagrams, tables, graphs, and charts.
Format: • Translate between representations of data • Compare how representations of data support inferences and predictions
Content Limits: Limit correct graphs to charts, tables, bar graphs, pictographs, line graphs, circle graphs, and Venn diagrams.
Primary Process Standards: Process Standard 1: Problem Solving Process Standard 2: Communication Process Standard 3: Reasoning Process Standard 4: Connections Process Standard 5: Representation
Distractor Domain: • Misreported data • Unsupportable conclusions • Inappropriate representation
t-CHARTS/ORGANIZING DATA
To be successful in math we need to know how to organize data.
Chart/graph is ways to display data visually
One way to organize data is to create a table or chart like this one below.
Chart/graph is ways to display data visually
One way to organize data is to create a table or chart like this one below.
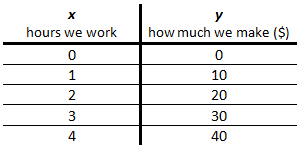
What would you predict about how much you would make for 5 hours of work?
Bar Graphs
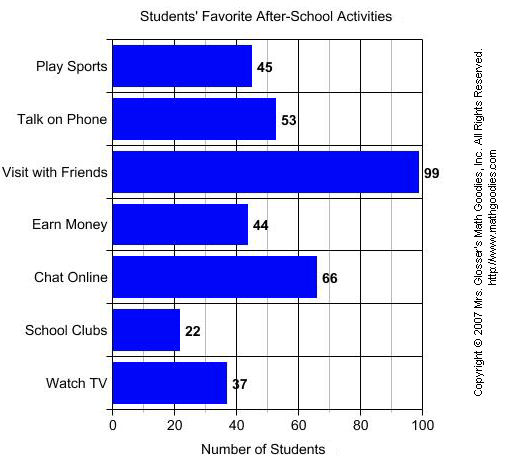
Another way to display data is in the form of graphs. There are many varieties of graphs to choose from. A bar graph is a graph that comares data from several situations using vertical or horizontal bars. A bar graph is a graph that compares data from several situations using vertical or horizontal bars. A bar graph may be used to record and display data such as favorite after school activities, or favorite types of movies.
All bar graph should have a title and the axes should be properly labeled as you can see above. The horizontal or X-axis displays the types of movies, while the vertical or y-axis displays how many people enjoy what movies. The height of the bar tells how many people like what movies compared to others.
Scale
The horizontal scale across the bottom and the vertical scale along the side of a graph tell us how much or how many.
